Training a machine learning model is an optimization problem. The goal is to find the set of model parameters that minimizes a loss function, which measures how well the model fits the training data. Gradient-based methods are the standard tools for navigating the high-dimensional “loss landscape” to find this minimum.
For econometricians, the key connection is that this is the same basic problem as nonlinear least squares or maximum likelihood estimation: choose parameters to minimize an objective function. In modern machine-learning applications, several features are often more pronounced: parameter spaces can be very large, objectives are frequently non-convex, and iterative gradient-based updates play a central role.
This chapter explains how these optimization methods work at a general level. The feed-forward neural networks chapter later applies this machinery to network training and backpropagation.
3.2 Roadmap
We begin with gradient descent, which can be interpreted as repeatedly moving the parameters in the direction that most steeply reduces the loss.
We then compare batch, stochastic, and mini-batch updates—gradients computed from the full sample, a single observation, or a small random subset—since this distinction is central in machine learning practice.
Next, we discuss the main weaknesses of plain gradient descent and motivate more advanced optimizers.
We then study momentum and adaptive-gradient methods that use past gradients to smooth the update, adjust its scale coordinate by coordinate, or do both.
Finally, we compare their behavior visually and summarize practical lessons for modern machine-learning estimation.
3.3 The Core Idea for Optimization: Gradient Descent
Imagine you are standing on a foggy mountain and want to get to the lowest valley. The simplest strategy is to look at the ground at your feet and take a step in the steepest downhill direction. You repeat this process until further steps no longer reduce the loss.
This downhill strategy is the core intuition behind Gradient Descent.
The “mountain” is the loss landscape.
Your “position” is the current set of model parameters, \boldsymbol \theta.
The “steepest downhill direction” is the negative of the gradient of the loss function L with respect to the parameters, -\nabla_{\boldsymbol \theta} L(\boldsymbol \theta).
where \eta is the learning rate, a hyperparameter that controls the step size. As in the cross-validation chapter, a hyperparameter configures the fitting procedure and is chosen by a separate validation criterion rather than by minimizing the training loss over \boldsymbol\theta.
The main challenge is how to compute the gradient \nabla_{\boldsymbol \theta} L(\boldsymbol \theta). The way we use our training data to compute it leads to three main variants of gradient descent.
3.4 Notation
The notation below is used throughout the chapter:
Setup: Consider a training dataset \mathcal{D}=\{(x_i,y_i)\}_{i=1}^N and parameter vectors \boldsymbol{\theta} \in \mathbb{R}^m.
Key definitions:
\ell_i(\boldsymbol{\theta}) = \ell(y_i, \hat{y}_i(\boldsymbol{\theta})): loss for observation i. The loss function \ell is the one the cross-validation chapter wrote as L(y,\hat y); this chapter uses a different letter because L is reserved for the average below.
L(\boldsymbol{\theta}) = \frac{1}{N}\sum_{i=1}^N \ell_i(\boldsymbol{\theta}): average training loss, that is, the empirical risk of the cross-validation chapter evaluated on the training sample and written as a function of \boldsymbol{\theta}. This is the objective the algorithms below minimize.
x_i: predictors, y_i: observed value, \hat{y}_i: predicted/fitted value depending on \boldsymbol{\theta}
Following the case convention fixed in the information theory chapter, the data (x_i,y_i) enter this chapter as realized values: the algorithms condition on the training dataset throughout, and the randomness in the stochastic methods below comes from data subsampling.
Notation Convention
For brevity, we may write \hat{y}_i instead of \hat{y}_i(\boldsymbol{\theta}), but remember that predictions always depend on the current parameters.
3.5 Batch, Stochastic, and Mini-Batch Gradient Descent
Batch Gradient Descent
In Batch Gradient Descent (BGD), we calculate the gradient of the loss function using the entire training dataset at once. With learning rate \eta > 0 and starting value \boldsymbol{\theta}^{(0)}, the gradient for iteration t=1,\ldots,T is:
Pros: The gradient is the exact training-set gradient, giving a smooth, deterministic path. Exactness does not by itself guarantee convergence, which also depends on the shape of the loss and the learning rate.
Cons: Each parameter update requires processing the entire training sample, which makes updates computationally intensive, especially on large datasets.
Stochastic Gradient Descent (SGD)
In Stochastic Gradient Descent, we calculate the gradient and update the parameters using just one training observation at a time. The gradient approximation reads as follows:
\nabla_{\boldsymbol \theta} L(\boldsymbol{\theta}^{(t-1)}) \approx \nabla_{\boldsymbol \theta} \ell_i(\boldsymbol{\theta}^{(t-1)}) \quad \text{for a randomly drawn index } i
Using only one data point per update instead of all i = 1, \dots, N is a coarse approximation to the full gradient.
Note
Pros: SGD is fast per update and requires little memory; the noisy updates can sometimes move through shallow basins that trap a deterministic path, although they do not guarantee escape from local minima.
Cons: The path to the minimum is noisy and erratic; with a constant step size the iterates generally keep fluctuating rather than converging to a fixed point.1
Mini-Batch Gradient Descent
Mini-Batch Gradient Descent is the standard approach for training the neural networks studied later in the book because it balances BGD and SGD. The gradient is computed on a small, random subset of the data called a mini-batch.
More precisely, partition the observation indices into J nonempty batches B_j such that \bigcup_{j=1}^J B_j = \{1,\ldots,N\} and B_j \cap B_{j'} = \emptyset for j\neq j'. With learning rate \eta > 0 and starting value \boldsymbol{\theta}^{(0)}, we get the following gradient approximation for the selected batch B_j:
Let b denote the target mini-batch size; common choices are 32, 64, or 128. Equal batch sizes require b to divide N; otherwise the final batch can be smaller, and the formulas above use its actual size |B_j|. One epoch is one full pass through the training data. The total number of updates T does not need to coincide with the number of batches J. Typically, J \ll T: after processing every batch in an epoch, we reshuffle the data, form a new partition, and continue updating the parameters.
Note
Pros: Mini-Batch Gradient Descent balances the stability of Batch Gradient Descent with the speed of SGD.
Cons: It introduces an additional hyperparameter (the batch size) to (potentially) tune.
The two limiting choices recover the earlier methods:
If |B_j| = 1 for each batch used in the update, the method reduces to SGD.
If J = 1 with B_1 = \{1,\ldots,N\}, the method reduces to Batch Gradient Descent.
Algorithm: Mini-Batch Training by Epoch
The following pseudocode implements the epoch-based partitioning scheme described above:
Define n_e \in \mathbb{N}\setminus\{0\} as the number of epochs used for training; within each epoch the J batches defined above are processed once.
Algorithm: Mini-Batch Gradient Descent Training
Input: Training data \{(x_i, y_i)\}_{i=1}^N, learning rate \eta, batch size b, number of epochs n_e, maximum number of iterations T
Initialize:\boldsymbol{\theta}^{(0)}, set t = 0
Repeat fore = 1, \ldots, n_e(epochs):
Shuffle training data \{(x_i, y_i)\}_{i=1}^N
For each batchB_j where j = 1, \ldots, J:
Compute fitted values:\hat{y}_i = f(x_i; \boldsymbol{\theta}^{(t)}) for all observations in B_j
Check stopping rule: If a convergence criterion is reached or t=T, set t^\ast=t and stop the algorithm
If no earlier stopping rule is met, set t^\ast=t after the final epoch.
Output: Final parameters \boldsymbol{\theta}^{(t^\ast)}, where t^\ast is the realized stopping iteration
3.6 Challenges and Advanced Optimizers
Challenges with Vanilla Gradient Descent
Choosing the right learning rate \eta is difficult
The same learning rate applies to all parameters, which may not be ideal
It can get stuck in saddle points, where the gradient is zero but the point is neither a local minimum nor a local maximum, which are common in high-dimensional landscapes (Dauphin et al. 2014)
To address these issues, researchers have developed update rules that use past gradients to smooth the direction, adjust the learning rate for each parameter, or do both.
In all of the following algorithms, we choose a learning rate \eta > 0 and a starting value \boldsymbol{\theta}^{(0)}. Consider iteration steps t = 1,\ldots,T, and define \boldsymbol g_t = \frac{1}{N} \sum_{i = 1}^N \nabla_{\boldsymbol{\theta}}\ell_i(\boldsymbol{\theta}^{(t-1)}) as the gradient used for the tth update. We can combine all methods below with mini-batches, but leave this out for brevity in notation.
Momentum
The momentum idea traces to Polyak (1964), who introduced the “heavy ball” method to accelerate iterative optimization, and Nesterov (1983), whose accelerated-gradient variant achieves a provably better convergence rate on smooth convex objectives. Momentum replaces the current gradient with an exponentially weighted moving average of current and past gradients, creating a “velocity” term \boldsymbol u_t. Alternating signs partly cancel in this average, while persistent directions remain. The relation between u_t, g_t and \theta^{(t)} is as follows:
with \boldsymbol u_0 = \mathbf 0. (Note the timing: \boldsymbol g_t is evaluated at \boldsymbol \theta^{(t-1)}, and the tth update produces \boldsymbol \theta^{(t)}—the same convention as for the algorithms below.)
Here, \delta \in [0,1) is the momentum coefficient. Because the weights \delta and 1-\delta sum to one, \boldsymbol u_t is an exponentially weighted moving average on the same long-run scale as \boldsymbol g_t.
Optional: The unnormalized momentum convention
This normalization is a convention: Polyak’s original heavy-ball recursion, and the momentum option in many software implementations, instead uses \boldsymbol u_t=\delta\boldsymbol u_{t-1}+\boldsymbol g_t. Under a constant gradient, that unnormalized velocity converges to \boldsymbol g/(1-\delta), so its learning rate should be smaller by a factor of approximately 1-\delta when translating from the convention used here. We retain the normalized convention throughout because it matches Adam’s first-moment recursion below.
AdaGrad (Adaptive Gradient)
AdaGrad adapts the learning rate for each parameter individually. It assigns a larger effective learning rate to coordinates with smaller accumulated squared gradients and a smaller effective learning rate to coordinates with persistently large gradients (Duchi, Hazan, and Singer 2011). The actual update still multiplies this rate by the current gradient. AdaGrad implements the scaling by dividing the learning rate by the square root of the sum of past squared gradients for that parameter.
Two versions appear in the literature. The full-matrix version accumulates the outer products
where m is the number of parameters, \boldsymbol I_m is the m \times m identity matrix, and \varepsilon>0 ensures that \boldsymbol{\mathcal G}_t is positive definite and therefore has an inverse square root.
This form is mathematically clean but computationally infeasible in high-dimensional models: storing an m \times m matrix and computing its inverse square root, with m in the millions, is impractical.
The version commonly used in software (and called AdaGrad below) retains only coordinate-wise squared gradients, a form of so-called diagonal preconditioning. Define the elementwise gradient accumulator
In the diagonal update, the small constant \varepsilon prevents division by zero. This is a diagonal analogue rather than the literal diagonal of the regularized full-matrix formula above: the full-matrix display adds \varepsilon\boldsymbol I_m before the inverse square root, whereas the displayed diagonal convention adds \varepsilon after the square root. Software implementations vary in this placement. Throughout this book, AdaGrad refers to the diagonal version unless stated otherwise.
RMSprop (Root Mean Square Propagation)
RMSprop—which circulated through Hinton’s lecture notes (Hinton 2012) and was never formally published—modifies AdaGrad to resolve its main issue of a learning rate that decreases typically too fast. Instead of accumulating all past squared gradients, RMSprop uses an exponentially decaying average, avoiding automatic growth from accumulating the entire gradient history. The accumulator stays bounded when the gradients are uniformly bounded; it can still grow without bound if gradient magnitudes keep increasing. Define \boldsymbol g_t as above and \boldsymbol g_t^2 as the elementwise product of \boldsymbol g_t times \boldsymbol g_t; that is, \boldsymbol g_t^2 = \boldsymbol g_t \odot \boldsymbol g_t.
The update rules are (with \boldsymbol v_0 = \mathbf 0):
Compute decaying average of squared gradients: \boldsymbol v_t = \rho \boldsymbol v_{t-1} + (1 - \rho) \boldsymbol g_t^2
Update parameters: \boldsymbol{\theta}^{(t)} = \boldsymbol{\theta}^{(t-1)} - \eta \frac{1}{\sqrt{\boldsymbol v_t} + \varepsilon} \boldsymbol g_t Here, \boldsymbol v_t is the moving average of squared gradients, and \rho is the squared-gradient decay rate (e.g., 0.9), distinct from the momentum coefficient \delta above. The division and square root are elementwise. By “forgetting” the distant past, RMSprop keeps the learning rate adaptive and responsive throughout training.
Adam (Adaptive Moment Estimation)
Adam is widely used for neural networks (Kingma and Ba 2015). It combines the ideas of Momentum (using the first moment, or mean, of the gradients) and RMSprop (using the uncentered second moment of the gradients).
The algorithm maintains two moving averages:
First moment estimate (momentum), with first-moment decay \beta_1: \boldsymbol m_t = \beta_1 \boldsymbol m_{t-1} + (1 - \beta_1) \boldsymbol g_{t}
Here \beta_1,\beta_2 \in [0,1) play the roles that \delta and \rho played for Momentum and RMSprop, respectively. The moment symbols \boldsymbol m_t and \boldsymbol v_t are the standard notation of Kingma and Ba (2015); the letter m in \boldsymbol m_t is unrelated to the parameter dimension m from the chapter setup. Since \boldsymbol m_t and \boldsymbol v_t are initialized as zero vectors, they are biased toward zero, especially during the initial time steps. To speak of a bias we need randomness in the gradients, which is where the mini-batches suppressed from our notation re-enter: think of \boldsymbol g_\tau as the gradient of a randomly drawn batch, with expectations taken over batch sampling. If the gradient mean and uncentered second moment are constant across updates, \mathbb{E}[\boldsymbol g_\tau]=\boldsymbol\mu and \mathbb{E}[\boldsymbol g_\tau\odot\boldsymbol g_\tau]=\boldsymbol\nu, then unrolling the recursions gives \mathbb{E}[\boldsymbol m_t]=(1-\beta_1^t)\boldsymbol\mu and \mathbb{E}[\boldsymbol v_t]=(1-\beta_2^t)\boldsymbol\nu. Adam corrects the resulting zero-initialization attenuation by rescaling:
The correction restores unbiasedness of the two moment estimates under those constant-moment conditions. During actual training, gradient means and second moments drift across iterations, so the correction is approximate but still removes the mechanical attenuation from zero initialization.
Adam is a common starting point because it combines a smoothed direction with coordinate-specific scaling. This design can reduce sensitivity to differences in gradient scale across coordinates, but whether it delivers lower training loss or better out-of-sample performance is problem-dependent. Optimizer choice and tuning therefore remain part of the validation exercise.
3.7 Optimizer Comparison
Having derived the update rules one by one, we now place their computational tradeoffs side by side. The column Optimizer state reports the number of additional state scalars stored per scalar model parameter, equivalently the number of parameter-shaped state buffers stored alongside the parameter vector. It reflects the memory overhead of the update rule and should not be confused with dataset memory, which is controlled separately by the batch size. The citations in the algorithm column identify original or standard sources for the underlying methods; as noted in the optional callout of the Momentum section, the normalized Momentum convention used in this chapter differs from Polyak’s original heavy-ball recursion. The remaining columns give criterion-specific comparisons that are qualified immediately below the table.
Combines momentum with coordinate-specific scaling
Highest optimizer-state memory; adaptive scaling does not eliminate learning-rate tuning
The advantage and limitation entries describe typical behavior at reasonable tunings; none is unconditional. Actual performance depends on the objective’s geometry, the noise induced by mini-batching, and the learning-rate choice. On non-convex objectives, no method on this list is guaranteed to reach a global minimum.
3.8 Visualizing Optimizers
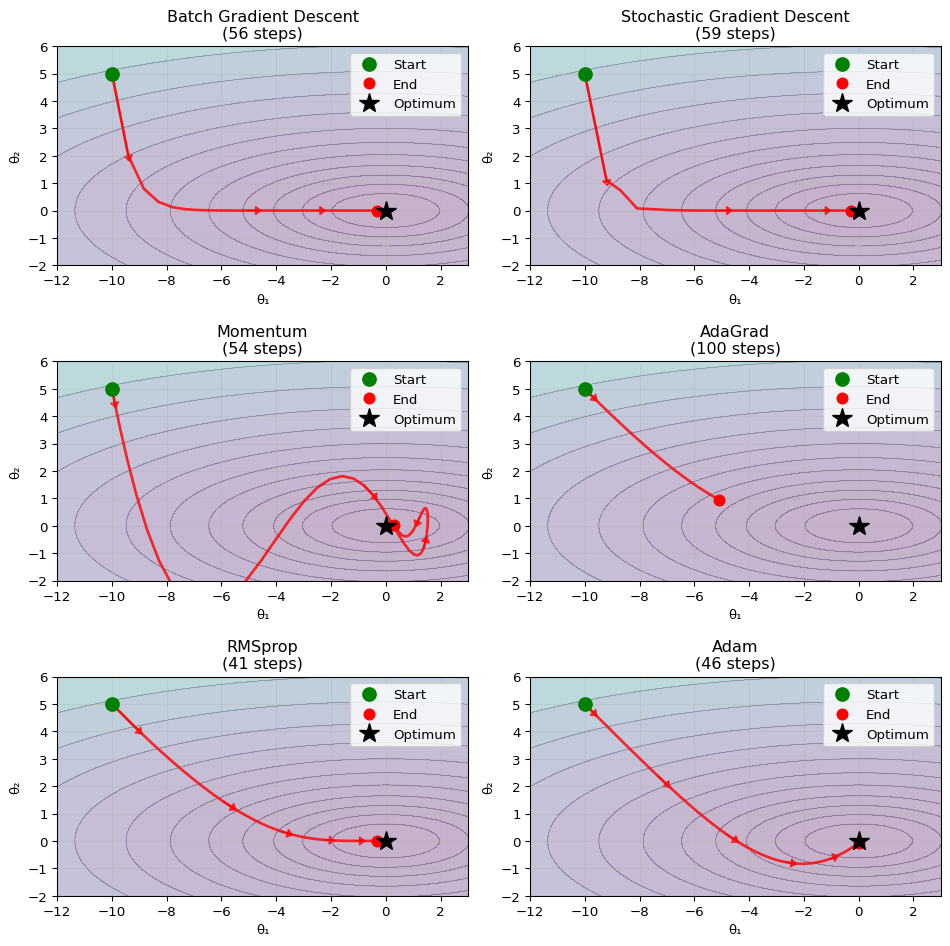
The following plot shows the paths taken by different optimizers on a contour plot of the loss function
which is a quadratic with uneven curvature across directions, as in Exercise 3.1. Its Hessian eigenvalues are 0.2 and 2, so the ratio of the largest to the smallest eigenvalue, its condition number, is 2/0.2=10. The two coordinates are interchanged relative to that exercise: here the flat direction is \theta_1 and the steep one is \theta_2, whereas Exercise 3.1 places the larger eigenvalue \lambda_{\max} on \theta_1.
The algorithms stop after at most 100 iterations, with stopping criterion L(\theta_1,\theta_2)<1.01 (close to the global minimum value of 1). Most optimizers use a learning rate of 0.3. The Momentum panel uses 0.5 to compensate partly for the normalized velocity’s slow initial response: starting from \boldsymbol u_0=\mathbf 0, its weights build over roughly 1/(1-\delta)=10 iterations when \delta=0.9. Because there is no empirical loss or dataset behind the contour, the noisy-gradient panel adds artificial Gaussian noise to the exact gradient. It illustrates stochastic-gradient-like variability but is not literal SGD generated by sampling observations or mini-batches.
Show the code
import numpy as npimport matplotlib.pyplot as plt# Set random seed for reproducibilitynp.random.seed(42)# Define loss function (less elongated for clearer visualization)def f(x, y):return1+0.1* x**2+1* y**2# Less extreme ratiodef df(x, y):return0.2* x, 2* ydef run_batch_gd(x0, y0, lr=0.3, n_steps=100):"""Pure batch gradient descent - smooth path""" path = [(x0, y0)] x, y = x0, y0for _ inrange(n_steps): gx, gy = df(x, y) x -= lr * gx y -= lr * gy path.append((x, y))if f(x, y) <1.01:breakreturn np.array(path)def run_noisy_gd(x0, y0, lr=0.3, n_steps=100):"""Gradient descent with artificial gradient noise.""" path = [(x0, y0)] x, y = x0, y0 np.random.seed(123) noise_scale =0.3for step inrange(n_steps): gx_base, gy_base = df(x, y) gx_noise = np.random.normal(0, noise_scale *abs(gx_base)) gy_noise = np.random.normal(0, noise_scale *abs(gy_base)) gx = gx_base + gx_noise gy = gy_base + gy_noise x -= lr * gx y -= lr * gy path.append((x, y))if f(x, y) <1.01:breakreturn np.array(path)def run_momentum(x0, y0, lr=0.5, beta=0.9, n_steps=100):"""Momentum optimizer with convex-combination velocity (matches the text).""" path = [(x0, y0)] x, y = x0, y0 vx, vy =0, 0# Initialize velocityfor _ inrange(n_steps): gx, gy = df(x, y)# Velocity as convex combination (matches u_t = beta u_{t-1} + (1 - beta) g_t) vx = beta * vx + (1- beta) * gx vy = beta * vy + (1- beta) * gy# Update parameters x -= lr * vx y -= lr * vy path.append((x, y))if f(x, y) <1.01:breakreturn np.array(path)def run_adagrad(x0, y0, lr=0.3, eps=1e-8, n_steps=100):"""AdaGrad optimizer - shows stalling behavior""" path = [(x0, y0)] x, y = x0, y0 gx_sum_sq, gy_sum_sq =0, 0for _ inrange(n_steps): gx, gy = df(x, y)# Accumulate squared gradients gx_sum_sq += gx**2 gy_sum_sq += gy**2# AdaGrad update - learning rate decreases over time effective_lr_x = lr / (np.sqrt(gx_sum_sq) + eps) effective_lr_y = lr / (np.sqrt(gy_sum_sq) + eps) x -= effective_lr_x * gx y -= effective_lr_y * gy path.append((x, y))if f(x, y) <1.01:breakreturn np.array(path)def run_rmsprop(x0, y0, lr=0.3, rho=0.9, eps=1e-8, n_steps=100):"""RMSprop optimizer - maintains learning rate""" path = [(x0, y0)] x, y = x0, y0 vx, vy =0, 0for _ inrange(n_steps): gx, gy = df(x, y)# Update moving average of squared gradients vx = rho * vx + (1- rho) * gx**2 vy = rho * vy + (1- rho) * gy**2# RMSprop update - learning rate stays more stable effective_lr_x = lr / (np.sqrt(vx) + eps) effective_lr_y = lr / (np.sqrt(vy) + eps) x -= effective_lr_x * gx y -= effective_lr_y * gy path.append((x, y))if f(x, y) <1.01:breakreturn np.array(path)def run_adam(x0, y0, lr=0.3, beta1=0.9, beta2=0.999, eps=1e-8, n_steps=100):"""Adam optimizer""" path = [(x0, y0)] x, y = x0, y0 mx, my =0, 0 vx, vy =0, 0for t inrange(1, n_steps +1): gx, gy = df(x, y)# Update moments mx = beta1 * mx + (1- beta1) * gx my = beta1 * my + (1- beta1) * gy vx = beta2 * vx + (1- beta2) * gx**2 vy = beta2 * vy + (1- beta2) * gy**2# Bias correction mx_hat = mx / (1- beta1**t) my_hat = my / (1- beta1**t) vx_hat = vx / (1- beta2**t) vy_hat = vy / (1- beta2**t)# Update parameters x -= lr * mx_hat / (np.sqrt(vx_hat) + eps) y -= lr * my_hat / (np.sqrt(vy_hat) + eps) path.append((x, y))if f(x, y) <1.01:breakreturn np.array(path)# Run all optimizers from the same starting pointstart_x, start_y =-10, 5path_batch = run_batch_gd(start_x, start_y)path_noisy = run_noisy_gd(start_x, start_y)path_momentum = run_momentum(start_x, start_y)path_adagrad = run_adagrad(start_x, start_y)path_rmsprop = run_rmsprop(start_x, start_y)path_adam = run_adam(start_x, start_y)# Plot - using a 3x2 grid to accommodate all 6 optimizersfig, axes = plt.subplots(3, 2, figsize=(10, 10))axes = axes.flatten()paths_and_titles = [ (path_batch, 'Batch Gradient Descent'), (path_noisy, 'Noisy Gradient Descent'), (path_momentum, 'Momentum'), (path_adagrad, 'AdaGrad'), (path_rmsprop, 'RMSprop'), (path_adam, 'Adam')]# Shared limits include every path, with padding for markers and arrows.all_points = np.vstack([path for path, _ in paths_and_titles] + [np.zeros((1, 2))])path_min = all_points.min(axis=0)path_max = all_points.max(axis=0)padding =0.1* np.maximum(path_max - path_min, 1.0)x_limits = (path_min[0] - padding[0], path_max[0] + padding[0])y_limits = (path_min[1] - padding[1], path_max[1] + padding[1])X, Y = np.meshgrid(np.linspace(*x_limits, 150), np.linspace(*y_limits, 150))Z = f(X, Y)for i, (path, title) inenumerate(paths_and_titles): ax = axes[i]# Create contour background levels = np.logspace(0, 2, 15) # Better level spacing ax.contour(X, Y, Z, levels=levels, alpha=0.6, colors='gray', linewidths=0.5) ax.contourf(X, Y, Z, levels=levels, alpha=0.3, cmap='viridis')# Plot optimization path ax.plot(path[:, 0], path[:, 1], 'r-', linewidth=2, alpha=0.8) ax.plot(path[0, 0], path[0, 1], 'go', markersize=10, label='Start', zorder=5) ax.plot(path[-1, 0], path[-1, 1], 'ro', markersize=8, label='End', zorder=5) ax.plot(0, 0, 'k*', markersize=15, label='Optimum', zorder=5)# Add arrows to show direction (fewer arrows for clarity)iflen(path) >5: arrow_indices = np.linspace(0, len(path)-2, min(6, len(path)-1), dtype=int)for j in arrow_indices: dx = path[j+1, 0] - path[j, 0] dy = path[j+1, 1] - path[j, 1]# Only draw arrow if movement is significantif np.sqrt(dx**2+ dy**2) >0.1: ax.arrow(path[j, 0], path[j, 1], dx, dy, head_width=0.3, head_length=0.2, fc='red', ec='red', alpha=0.7) ax.set_aspect('equal', adjustable='box') ax.set_title(f'{title}\n({len(path)-1} steps)') ax.set_xlabel('θ₁') ax.set_ylabel('θ₂') ax.legend(loc='upper right') ax.grid(True, alpha=0.3) ax.set_xlim(*x_limits) ax.set_ylim(*y_limits)plt.tight_layout()plt.show()
Figure 3.1: Paths of six update rules on the quadratic L(\theta_1,\theta_2)=1+0.1\,\theta_1^2+\theta_2^2, which has uneven curvature across directions and a Hessian condition number of 10. In each panel the red line traces the parameter path from the common starting point (green dot) to the final iterate (red dot); the black star marks the global optimum at the origin, gray contour lines show loss levels, and the panel title reports the number of steps taken. The noisy-gradient panel adds artificial Gaussian noise to the exact gradient rather than sampling observations from an empirical loss.
The panels in Figure 3.1 separate several effects. Batch Gradient Descent follows a smooth path, while the artificial gradient noise makes the neighboring path visibly more irregular. Momentum initially lags the current gradient and then overshoots across the steep direction, producing a curved, oscillatory route. AdaGrad’s ever-growing accumulator shortens later steps; RMSprop avoids carrying the entire gradient history and continues to adapt; and Adam combines a smoothed direction with coordinate-specific scaling. The step counts in the titles reinforce the main lesson: on this simple quadratic, no update rule dominates merely because it is more elaborate.
Note on Algorithm Performance
While Adam might not appear dramatically superior to other algorithms in this visualization, keep in mind that we are using a very well-behaved quadratic function for demonstration purposes. In practice, neural network loss landscapes are:
Highly non-convex with many local minima and saddle points
High-dimensional (often millions of parameters)
Unevenly curved across parameter directions. In a locally positive-definite quadratic approximation, ill-conditioning is measured by \kappa=\lambda_{\max}/\lambda_{\min} over the positive Hessian eigenvalues, with large \kappa indicating a difficult local geometry. In non-convex regions the Hessian can instead have zero or negative eigenvalues, so this ratio is not a global condition number for the entire landscape.
Optimized with noisy gradient estimates when mini-batch sampling is used. Conditional on the training data, the empirical loss landscape is fixed; the sampled gradient and resulting update path vary across batches.
In such landscapes, Adam’s adaptive scaling and momentum can make early training less sensitive to differences in gradient scale across coordinates than plain gradient descent with one global learning rate. This is a statement about the behavior of the update rule, not a guarantee of a lower final training loss or better out-of-sample performance. The simple two-dimensional example therefore illustrates behavioral differences between optimizers; it does not rank them for complex prediction problems.
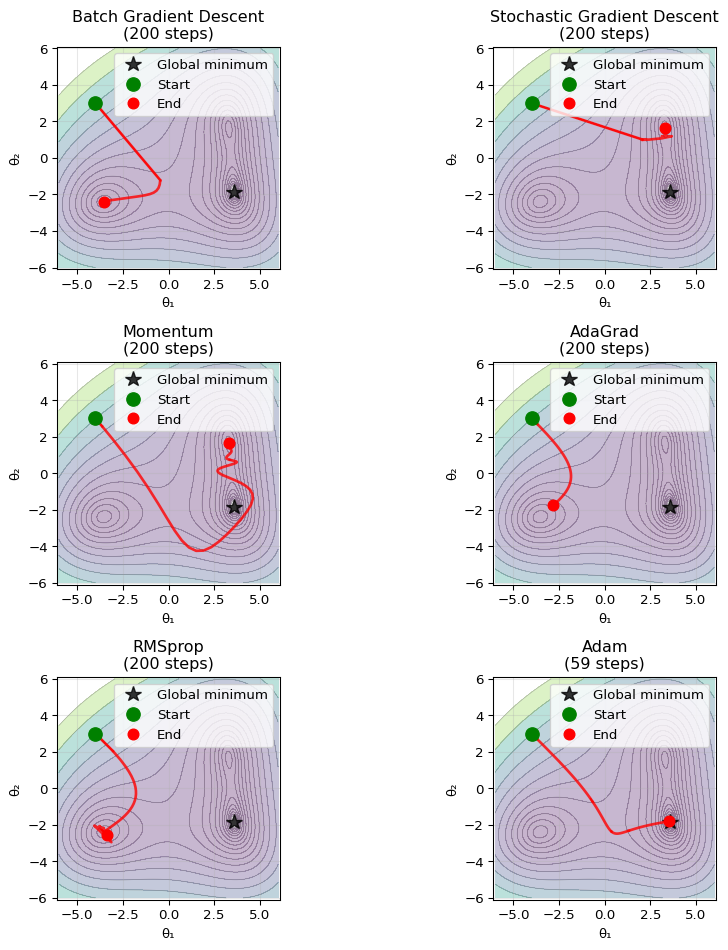
We can make the minimization problem more challenging with the constructed objective
This geometric example has several local minima, with its global minimum near (3.585,-1.850). With several basins, the minimum an algorithm reaches depends on both its trajectory and its tuning. The next comparison therefore illustrates path and basin selection under workable, rule-specific learning rates; it is not a common-learning-rate sensitivity experiment.
Three disclosures are needed to read the figure correctly. First, as in the quadratic comparison, the noisy-gradient panel adds artificial Gaussian noise to the exact gradient and is not literal SGD from sampled observations. Second, the non-adaptive methods use much smaller learning rates (0.01 for batch and noisy gradient descent, 0.001 for momentum) than the adaptive methods (0.3 for AdaGrad, RMSprop, and Adam). On this surface, coordinate-specific normalization changes the scale of a workable nominal learning rate: the chosen larger values give the adaptive methods useful movement, while batch gradient descent diverges at 0.3. These values are plot-specific, not universal requirements. Third, every panel stops when the loss falls below 1, after 200 iterations, or if a numerical failure produces a non-finite iterate; Adam uses \beta_2=0.999, matching the quadratic comparison. The panels therefore compare algorithm designs at workable tunings, not the algorithms at a common learning rate.
Show the code
import numpy as npimport matplotlib.pyplot as plt# Set random seed for reproducibilitynp.random.seed(42)# Define a more challenging non-convex function with multiple local minimadef f_nonconvex(x, y):return2/3* ((x**2+ y -11)**2+ (x + y**2-7)**2+ (x -4)**2* (y +2)**2)def df_nonconvex(x, y):# Partial derivative with respect to x dx = (2/3) * (4*x*(x**2+ y -11) +2*(x + y**2-7) +2*(x -4)*(y +2)**2)# Partial derivative with respect to y dy = (2/3) * (2*(x**2+ y -11) +4*y*(x + y**2-7) +2*(x -4)**2*(y +2))return dx, dy# Create contour plot for non-convex functionx_nc = np.linspace(-6, 6, 600)y_nc = np.linspace(-6, 6, 600)X_nc, Y_nc = np.meshgrid(x_nc, y_nc)Z_nc = f_nonconvex(X_nc, Y_nc)def run_optimizer_nonconvex(optimizer_func, x0, y0, **kwargs):"""Generic wrapper for running optimizers on non-convex function""" path = [(x0, y0)] x, y = x0, y0if'momentum'in optimizer_func.__name__: vx, vy =0, 0 lr = kwargs.get('lr', 0.3) beta = kwargs.get('beta', 0.9) n_steps = kwargs.get('n_steps', 200)for _ inrange(n_steps): gx, gy = df_nonconvex(x, y) vx = beta * vx + (1- beta) * gx vy = beta * vy + (1- beta) * gy x -= lr * vx y -= lr * vy path.append((x, y))ifnot np.isfinite(x) ornot np.isfinite(y) or f_nonconvex(x, y) <1:breakelif'adagrad'in optimizer_func.__name__: gx_sum_sq, gy_sum_sq =0, 0 lr = kwargs.get('lr', 0.3) eps = kwargs.get('eps', 1e-8) n_steps = kwargs.get('n_steps', 200)for _ inrange(n_steps): gx, gy = df_nonconvex(x, y) gx_sum_sq += gx**2 gy_sum_sq += gy**2 effective_lr_x = lr / (np.sqrt(gx_sum_sq) + eps) effective_lr_y = lr / (np.sqrt(gy_sum_sq) + eps) x -= effective_lr_x * gx y -= effective_lr_y * gy path.append((x, y))ifnot np.isfinite(x) ornot np.isfinite(y) or f_nonconvex(x, y) <1:breakelif'rmsprop'in optimizer_func.__name__: vx, vy =0, 0 lr = kwargs.get('lr', 0.3) rho = kwargs.get('rho', 0.9) eps = kwargs.get('eps', 1e-8) n_steps = kwargs.get('n_steps', 200)for _ inrange(n_steps): gx, gy = df_nonconvex(x, y) vx = rho * vx + (1- rho) * gx**2 vy = rho * vy + (1- rho) * gy**2 x -= lr * gx / (np.sqrt(vx) + eps) y -= lr * gy / (np.sqrt(vy) + eps) path.append((x, y))ifnot np.isfinite(x) ornot np.isfinite(y) or f_nonconvex(x, y) <1:breakelif'adam'in optimizer_func.__name__: mx, my =0, 0 vx, vy =0, 0 lr = kwargs.get('lr', 0.3) beta1 = kwargs.get('beta1', 0.9) beta2 = kwargs.get('beta2', 0.999) eps = kwargs.get('eps', 1e-8) n_steps = kwargs.get('n_steps', 200)for t inrange(1, n_steps +1): gx, gy = df_nonconvex(x, y) mx = beta1 * mx + (1- beta1) * gx my = beta1 * my + (1- beta1) * gy vx = beta2 * vx + (1- beta2) * gx**2 vy = beta2 * vy + (1- beta2) * gy**2 mx_hat = mx / (1- beta1**t) my_hat = my / (1- beta1**t) vx_hat = vx / (1- beta2**t) vy_hat = vy / (1- beta2**t) x -= lr * mx_hat / (np.sqrt(vx_hat) + eps) y -= lr * my_hat / (np.sqrt(vy_hat) + eps) path.append((x, y))ifnot np.isfinite(x) ornot np.isfinite(y) or f_nonconvex(x, y) <1:breakelif'noisy_gd'in optimizer_func.__name__: lr = kwargs.get('lr', 0.3) n_steps = kwargs.get('n_steps', 200) np.random.seed(456) data_variance =0.2for _ inrange(n_steps): gx_base, gy_base = df_nonconvex(x, y) gx_noise = np.random.normal(0, data_variance *abs(gx_base *5.3)) gy_noise = np.random.normal(0, data_variance *abs(gy_base *5.3)) gx = gx_base + gx_noise gy = gy_base + gy_noise x -= lr * gx y -= lr * gy path.append((x, y))ifnot np.isfinite(x) ornot np.isfinite(y) or f_nonconvex(x, y) <1:breakelse: # Batch GD lr = kwargs.get('lr', 0.3) n_steps = kwargs.get('n_steps', 200)for _ inrange(n_steps): gx, gy = df_nonconvex(x, y) x -= lr * gx y -= lr * gy path.append((x, y))ifnot np.isfinite(x) ornot np.isfinite(y) or f_nonconvex(x, y) <1:breakreturn np.array(path)# Define dummy functions for the wrapperdef run_batch_gd_nc(): passdef run_noisy_gd_nc(): passdef run_momentum_nc(): passdef run_adagrad_nc(): passdef run_rmsprop_nc(): passdef run_adam_nc(): pass# Run all optimizers from the same challenging starting pointstart_x_nc, start_y_nc =-4, 3# Start far from any minimumpath_batch_nc = run_optimizer_nonconvex(run_batch_gd_nc, start_x_nc, start_y_nc, lr=0.01)path_noisy_nc = run_optimizer_nonconvex(run_noisy_gd_nc, start_x_nc, start_y_nc, lr=0.01)path_momentum_nc = run_optimizer_nonconvex(run_momentum_nc, start_x_nc, start_y_nc, lr=0.001, beta=0.9)path_adagrad_nc = run_optimizer_nonconvex(run_adagrad_nc, start_x_nc, start_y_nc, lr=0.3)path_rmsprop_nc = run_optimizer_nonconvex(run_rmsprop_nc, start_x_nc, start_y_nc, lr=0.3)path_adam_nc = run_optimizer_nonconvex(run_adam_nc, start_x_nc, start_y_nc, lr=0.3)# Plot - using a 3x2 grid for all 6 optimizersfig, axes = plt.subplots(3, 2, figsize=(10, 10))axes = axes.flatten()paths_and_titles_nc = [ (path_batch_nc, 'Batch Gradient Descent'), (path_noisy_nc, 'Noisy Gradient Descent'), (path_momentum_nc, 'Momentum'), (path_adagrad_nc, 'AdaGrad'), (path_rmsprop_nc, 'RMSprop'), (path_adam_nc, 'Adam')]# Numerical global minimum of the modified objective plotted aboveglobal_minima = [(3.584728, -1.849960)]for i, (path, title) inenumerate(paths_and_titles_nc): ax = axes[i]# Create contour background - use log scale for better visualization levels = np.logspace(0, 3.4, 20) ax.contour(X_nc, Y_nc, Z_nc, levels=levels, alpha=0.6, colors='gray', linewidths=0.5) ax.contourf(X_nc, Y_nc, Z_nc, levels=levels, alpha=0.3, cmap='viridis')# Plot the known global minimum once per panel gm_x, gm_y = global_minima[0] ax.plot(gm_x, gm_y, 'k*', markersize=12, alpha=0.8, label='Global minimum')# Plot optimization pathiflen(path) >1: ax.plot(path[:, 0], path[:, 1], 'r-', linewidth=2, alpha=0.8) ax.plot(path[0, 0], path[0, 1], 'go', markersize=10, label='Start', zorder=5) ax.plot(path[-1, 0], path[-1, 1], 'ro', markersize=8, label='End', zorder=5)# Add arrows for direction (fewer for clarity)iflen(path) >5: arrow_indices = np.linspace(0, len(path)-2, min(5, len(path)-1), dtype=int)for j in arrow_indices: dx = path[j+1, 0] - path[j, 0] dy = path[j+1, 1] - path[j, 1]if np.sqrt(dx**2+ dy**2) >0.05: ax.arrow(path[j, 0], path[j, 1], dx, dy, head_width=0.1, head_length=0.08, fc='red', ec='red', alpha=0.7) ax.set_aspect('equal', adjustable='box') ax.set_title(f'{title}\n({len(path)-1} steps)') ax.set_xlabel('θ₁') ax.set_ylabel('θ₂') ax.legend(loc='upper right') ax.grid(True, alpha=0.3) ax.set_xlim(-6.1, 6.1) ax.set_ylim(-6.1, 6.1)plt.tight_layout()plt.show()
Figure 3.2: Comparison of optimization algorithms on a non-convex loss landscape with multiple local minima. In each panel the red line traces the path from the common start (green dot) to the final iterate (red dot); the black star marks the global minimum and gray contours show loss levels. The noisy-gradient panel adds artificial Gaussian noise to the exact gradient rather than sampling observations from an empirical loss. Learning rates differ by design: 0.01 for batch and noisy gradient descent, 0.001 for momentum, and 0.3 for the adaptive methods (AdaGrad, RMSprop, Adam), for which coordinate-specific normalization changes the update scale. Every path stops when the loss falls below 1, after 200 iterations, or if an iterate becomes non-finite; Adam uses \beta_2=0.999.
The non-convex surface makes the design differences visible in a way the quadratic could not. Compare the endpoints across the panels of Figure 3.2: with several basins available, where an optimizer lands depends on its trajectory, not only on its speed. The non-adaptive methods follow the local downhill pull at their small workable step sizes, while coordinate scaling gives the adaptive methods visible movement through regions where the unscaled gradient is small. Neither behavior dominates: a path that crosses saddle regions quickly can also skip past a good basin. Optimizer comparisons should therefore use workable tunings for every candidate and the validation criterion relevant to the final prediction problem.
So far the objects being optimized were generic objective functions. The feed-forward neural networks chapter applies the same optimization ideas to networks, where gradients are computed by backpropagation.
3.9 Summary
Key Takeaways
Gradient descent updates parameters along the negative loss gradient.
Mini-batches trade computation per update against variability in the gradient estimate.
Momentum averages gradient directions, while AdaGrad and RMSprop rescale updates using squared-gradient history.
Adam combines first- and second-moment estimates with corrections for their zero initialization.
Common Pitfalls
Tune the learning rate even with adaptive optimizers, since overly large steps can still diverge.
Stopping at an iteration limit does not establish convergence.
A wider stability interval for momentum does not imply faster convergence.
Do not infer a universal optimizer ranking from two-dimensional examples with different learning rates.
3.10 Exercises
Exercise 3.1: Learning Rates in an Ill-Conditioned Quadratic Problem
The two coefficients are the eigenvalues of the constant Hessian \nabla^2 L=\operatorname{diag}(\lambda_{\max},\lambda_{\min}), so \theta_1 is the steep coordinate and \theta_2 the flat one. Suppose we apply gradient descent with constant learning rate \eta>0:
Derive the gradient and show that the updates satisfy
\theta_1^{(t+1)}=(1-\eta \lambda_{\max})\theta_1^{(t)},
\qquad
\theta_2^{(t+1)}=(1-\eta \lambda_{\min})\theta_2^{(t)}.
Show that the iterates converge to (0,0) for every initial value \boldsymbol{\theta}^{(0)} if and only if
0<\eta<\frac{2}{\lambda_{\max}}.
Write \kappa=\lambda_{\max}/\lambda_{\min}>1 for the condition number and take the learning rate \eta=1/\lambda_{\max}, which lies inside the stability interval of Part 2. Show that \theta_1 reaches zero after one update, whereas reducing |\theta_2| to a fraction \varepsilon\in(0,1) of its starting value |\theta_2^{(0)}|>0 requires at least (\kappa-1)\log(1/\varepsilon) updates. Then determine the coordinate-specific learning rates \eta_1 for \theta_1 and \eta_2 for \theta_2 under which both coordinates reach zero after one update.
Exam level. The exercise formalizes why optimization becomes difficult in ill-conditioned problems and why a single learning rate can be inadequate.
Hint for Part 2
A scalar recursion x_{t+1}=cx_t converges to zero from every starting value x_0 if and only if |c|<1.
Hint for Part 3
The number of updates t needed satisfies (1-1/\kappa)^t\le\varepsilon. Take logarithms and apply \log y\le y-1 to y=(1-1/\kappa)^{-1} to bound -\log(1-1/\kappa) from above.
Since \lambda_{\max}>\lambda_{\min}, we have \frac{2}{\lambda_{\max}}<\frac{2}{\lambda_{\min}}, so the binding restriction is
0<\eta<\frac{2}{\lambda_{\max}}.
Part 3: Why Ill-Conditioning Slows Optimization
At \eta=1/\lambda_{\max}, Part 1 gives \theta_1^{(1)}=(1-1)\theta_1^{(0)}=0, so the steep coordinate is solved after one update. The flat coordinate contracts by the factor 1-\eta\lambda_{\min}=1-1/\kappa per update, so |\theta_2^{(t)}|=(1-1/\kappa)^t|\theta_2^{(0)}|, and |\theta_2^{(t)}|\le\varepsilon|\theta_2^{(0)}| requires
so t\ge(\kappa-1)\log(1/\varepsilon). The number of updates needed in the flat direction therefore grows at least linearly in the condition number. Raising \eta would speed up the flat direction, but Part 2 caps \eta below 2/\lambda_{\max}, so with a single learning rate the contraction factor 1-\eta\lambda_{\min} in the flat direction always exceeds 1-2/\kappa. A single global learning rate cannot be well tuned for both directions at once.
With coordinate-specific learning rates, Part 1 becomes \theta_1^{(t+1)}=(1-\eta_1\lambda_{\max})\theta_1^{(t)} and \theta_2^{(t+1)}=(1-\eta_2\lambda_{\min})\theta_2^{(t)}, so \eta_1=1/\lambda_{\max} and \eta_2=1/\lambda_{\min} bring both coordinates to zero after one update. This divides each gradient coordinate by its own curvature, a diagonal preconditioner.
Exercise 3.2: Mini-Batch Gradients as Noisy Gradient Estimators
Assume N\ge2. Now draw a mini-batch B of size b, with 1\le b\le N, uniformly at random from \{1,\dots,N\} without replacement, and define the mini-batch gradient estimator
(Note the sampling scheme: the training algorithm in this chapter forms batches as a random partition of the data, whereas here a single batch is drawn by simple random sampling without replacement. The first batch of a freshly shuffled partition has exactly this distribution, so the calculations below describe it as well.)
Throughout, expectations and variances are over the draw of B, conditional on the realized observation-level gradients.
Show that
\mathbb{E}\left[\hat g_B(\boldsymbol{\theta})\right] = g(\boldsymbol{\theta}),
so the mini-batch gradient is an unbiased estimator of the full gradient.
Consider the scalar case where \nabla_{\boldsymbol{\theta}} \ell_i(\boldsymbol{\theta}) is replaced by z_i \in \mathbb{R}. Show that
\mathrm{Var}\left(\frac{1}{b}\sum_{i\in B} z_i\right)
=
\frac{N-b}{b(N-1)} \cdot \frac{1}{N}\sum_{i=1}^N (z_i-\bar z)^2,
where \bar z = \frac{1}{N}\sum_{i=1}^N z_i.
Show that the variance factor \frac{N-b}{b(N-1)} from Part 2 is strictly decreasing in b and evaluate it at b=1 and b=N. Conclude how the batch size affects the noise in the parameter updates. Then state one reason, given in this chapter’s comparison of batch and stochastic gradient descent, why such noise may nevertheless be useful in optimization, together with the qualification that accompanies it there.
Exam level. The exercise studies the randomness that comes from drawing a batch out of one realized finite sample.
Hint for Part 1
Write the mini-batch estimator as \frac{1}{b}\sum_{i=1}^N \mathbb{1}\{i\in B\}\nabla_{\boldsymbol\theta}\ell_i(\boldsymbol\theta) using inclusion indicators. By symmetry, each of the N observations is equally likely to be among the b drawn, so \mathbb{P}(i\in B)=b/N.
Hint for Part 2
Use the indicator representation of Part 1. Under sampling without replacement, \mathbb{P}(i\in B)=b/N and \mathbb{P}(i\in B,\ j\in B)=\frac{b(b-1)}{N(N-1)} for i\ne j; these give the variances and covariances of the indicators. Subtracting \bar z from every z_i does not change the variance, so you may assume \bar z=0, in which case \sum_{i\ne j}z_iz_j=-\sum_{i=1}^N z_i^2.
Solution
Part 1: Unbiasedness of the Mini-Batch Gradient
Let
\mathbb{1}\{i \in B\}
denote the inclusion indicator for observation i. Then
where the covariance is negative because drawing i leaves one fewer slot for j.
Subtracting the constant \bar z from every z_i shifts the estimator by exactly \bar z (every sample contains b terms) and leaves its variance unchanged, so we may assume \bar z = 0 without loss of generality; then \sum_{i\neq j} z_i z_j = \big(\sum_{i=1}^N z_i\big)^2 - \sum_{i=1}^N z_i^2 = -\sum_{i=1}^N z_i^2, where \sum_{i\neq j} runs over all ordered pairs i,j\in\{1,\dots,N\} with i\neq j. Expanding the variance of the weighted sum of indicators, \begin{align*}
\mathrm{Var}\left(\frac{1}{b}\sum_{i\in B} z_i\right)
&=
\frac{1}{b^2}\left[\sum_{i=1}^N \pi_i(1-\pi_i)\, z_i^2
+ \sum_{i\neq j} \big(\pi_{ij}-\pi_i\pi_j\big)\, z_i z_j\right] \\
&=
\frac{1}{b^2}\left[\frac{b(N-b)}{N^2}
+ \frac{b(N-b)}{N^2(N-1)}\right]\sum_{i=1}^N z_i^2,
\end{align*} using the sign flip from \sum_{i\neq j} z_i z_j = -\sum_{i=1}^N z_i^2 in the second term. The bracket simplifies to \frac{b(N-b)}{N^2}\cdot\frac{N}{N-1} = \frac{b(N-b)}{N(N-1)}, so
which is the stated formula (reinstating a general \bar z). Two sanity checks: at b = N the variance is zero, i.e. the full sample is drawn with certainty, and at b = 1 it reduces to S_N^2, the variance of a single random draw.
which is strictly decreasing in b because N/b is. At b=1 it equals 1, so a single-observation gradient has the full cross-sectional variance S_N^2; at b=N it equals 0, the exact full-sample gradient. Smaller mini-batches therefore produce noisier gradient estimators, and since the update is -\eta\hat g_B(\boldsymbol\theta), the parameter updates inherit this noise with variance scaled by \eta^2.
That noise can nevertheless be useful because the iterates do not follow a rigid deterministic path. As noted in the comparison of batch and stochastic gradient descent, noisy updates can sometimes move through shallow basins that trap a deterministic path; likewise, at a saddle point the exact gradient is zero and a deterministic update stalls, whereas a noisy gradient generally does not vanish. The qualification is that this is no guarantee: noise does not ensure escape from local minima.
where \eta>0 is the learning rate and \delta\in[0,1) is the momentum coefficient. As in the main text, the gradient used for update t is evaluated at \theta^{(t-1)}, and that update produces \theta^{(t)}.
Show that, for every t\ge2, \theta^{(t)} satisfies the second-order recursion
\theta^{(t)}
=
\big(1+\delta-\eta(1-\delta)a\big)\theta^{(t-1)}
-\delta \theta^{(t-2)}.
Show that when \delta=0 this reduces to the gradient descent recursion of Exercise 3.1, with the single curvature a here playing the role of \lambda_{\max} there. For the general case, use the following Schur-Cohn stability criterion (see, e.g., Hamilton 1994, sec. 1.2): a second-order linear recursion x_t=cx_{t-1}+dx_{t-2} with characteristic polynomial p(r)=r^2-cr-d converges to zero from every initial state if and only if p(1)>0, p(-1)>0, and |d|<1. Apply this to show that, for general \delta\in[0,1), the recursion converges to zero from every initial state (\theta^{(0)},u_0) if and only if
\eta<\frac{2(1+\delta)}{(1-\delta)\,a}.
Exam level. The exercise derives momentum’s stability region and uses characteristic roots to distinguish stable, oscillatory, and fast convergence.
When \delta=0 the lagged term vanishes. For the general case, identify c and d in the given stability criterion by matching the recursion to the form x_t=cx_{t-1}+dx_{t-2}. Then evaluate p(1), p(-1), and |d| separately. The criterion’s initial state is the pair (\theta^{(0)},\theta^{(1)}); for \delta>0 this pair is in one-to-one correspondence with (\theta^{(0)},u_0) through \theta^{(1)}=\theta^{(0)}-\eta\big(\delta u_0+(1-\delta)a\theta^{(0)}\big), so “every initial state” means the same thing for the momentum updates and for the second-order recursion.
Using \theta^{(t)}=\theta^{(t-1)}-\eta u_t, we obtain \begin{align*}
\theta^{(t)}
&=
\theta^{(t-1)}-\eta\left[\delta \frac{\theta^{(t-2)}-\theta^{(t-1)}}{\eta}+(1-\delta)a\theta^{(t-1)}\right] \\
&=
\theta^{(t-1)}-\delta(\theta^{(t-2)}-\theta^{(t-1)})-\eta(1-\delta)a\theta^{(t-1)} \\
&=
\big(1+\delta-\eta(1-\delta)a\big)\theta^{(t-1)}-\delta\theta^{(t-2)}.
\end{align*}
Part 2: Stability Analysis
When \delta=0, the recursion becomes \theta^{(t)}=(1-\eta a)\theta^{(t-1)}, which is the gradient descent recursion of Exercise 3.1 with a in place of \lambda_{\max}. This converges iff |1-\eta a|<1, i.e., 0<\eta<2/a.
For general \delta\in[0,1), write c=1+\delta-\eta(1-\delta)a. The recursion has characteristic polynomial
p(r)=r^2-cr+\delta.
By the stability criterion given in the exercise, the recursion converges to zero from every initial state if and only if p(1)>0, p(-1)>0, and |\delta|<1 all hold. Since the criterion is an equivalence, checking the three conditions settles both directions at once.
p(1)=1-c+\delta=\eta(1-\delta)a>0, which always holds.
Conditions (i) and (iii) hold automatically for \eta>0 and \delta\in[0,1), so the criterion reduces to (ii) alone. Therefore the recursion converges to zero from every initial state if and only if \eta<\frac{2(1+\delta)}{(1-\delta)\,a}.
3.11 References
Dauphin, Yann N., Razvan Pascanu, Caglar Gulcehre, Kyunghyun Cho, Surya Ganguli, and Yoshua Bengio. 2014. “Identifying and Attacking the Saddle Point Problem in High-Dimensional Non-Convex Optimization.” In Advances in Neural Information Processing Systems. Vol. 27. Curran Associates.
Duchi, John, Elad Hazan, and Yoram Singer. 2011. “Adaptive Subgradient Methods for Online Learning and Stochastic Optimization.”Journal of Machine Learning Research 12: 2121–59.
Kingma, Diederik P., and Jimmy Ba. 2015. “Adam: A Method for Stochastic Optimization.” In International Conference on Learning Representations. https://arxiv.org/abs/1412.6980.
Nesterov, Yurii. 1983. “A Method of Solving a Convex Programming Problem with Convergence Rate O(1/k^2).”Soviet Mathematics Doklady 27 (2): 372–76.
Polyak, Boris T. 1964. “Some Methods of Speeding up the Convergence of Iteration Methods.”USSR Computational Mathematics and Mathematical Physics 4 (5): 1–17. https://doi.org/10.1016/0041-5553(64)90137-5.
Robbins, Herbert, and Sutton Monro. 1951. “A Stochastic Approximation Method.”Annals of Mathematical Statistics 22 (3): 400–407. https://doi.org/10.1214/aoms/1177729586.
Footnotes
Under standard stochastic-approximation assumptions—including conditionally unbiased or suitably controlled gradients, bounded conditional second moments, and appropriate regularity and convexity or stability conditions—diminishing step sizes satisfying the Robbins–Monro conditions \sum_{t=1}^{\infty} \eta_t = \infty and \sum_{t=1}^{\infty} \eta_t^2 < \infty can yield convergence (Robbins and Monro 1951). The exact mode and rate of convergence depend on the assumptions imposed on the objective and gradient noise.↩︎